Industrial infrared thermography
Infrared Thermography Services That Turn Hidden Heat Into a Work Order
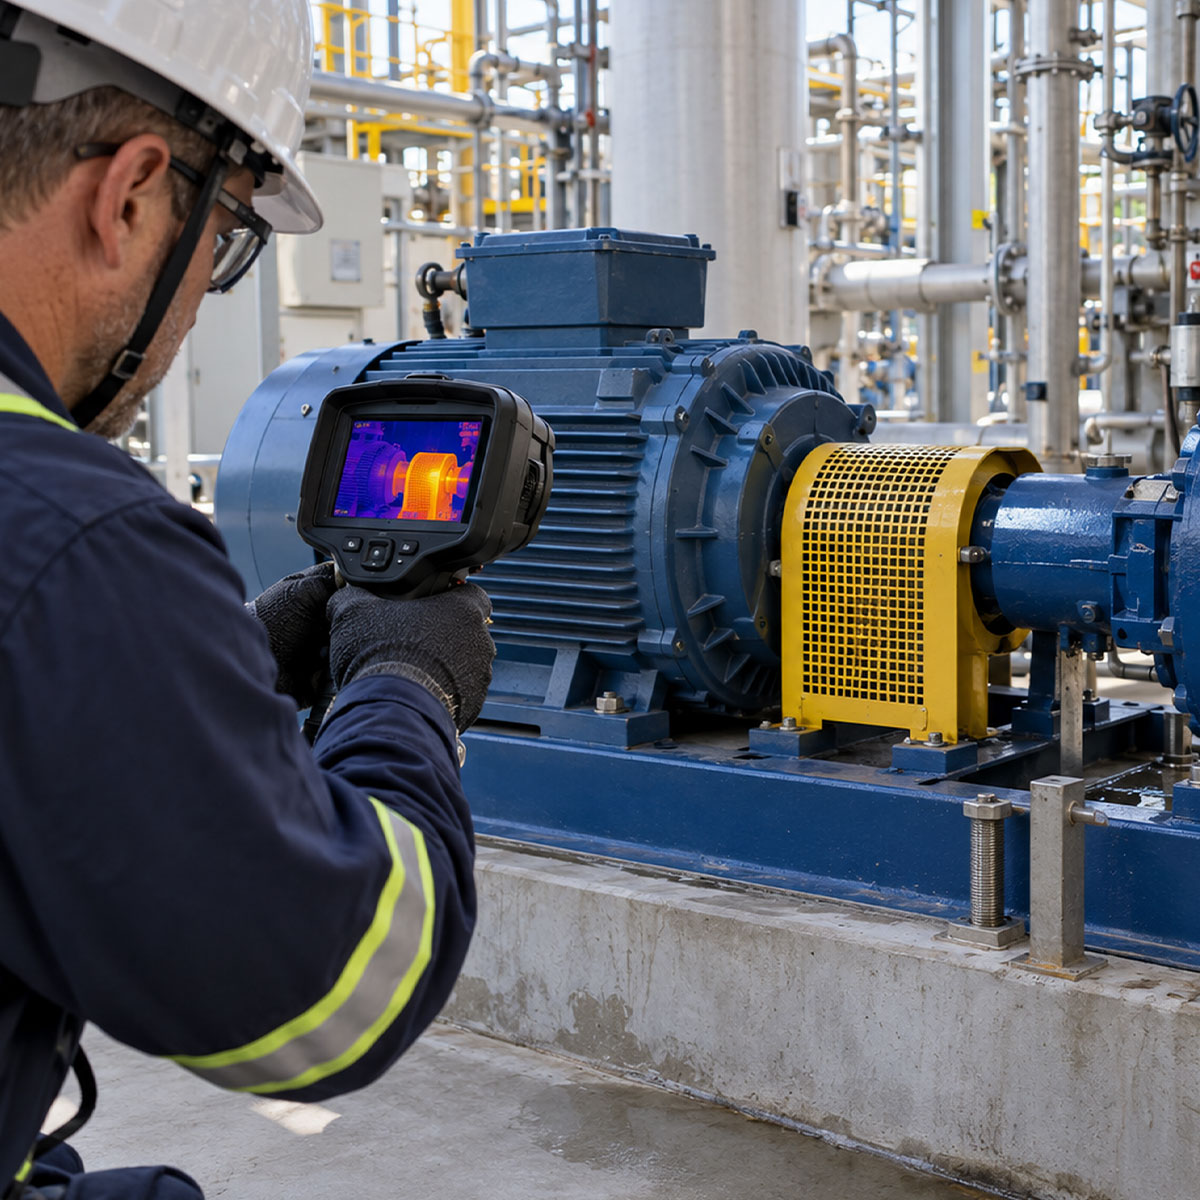
Infrared thermography is a non-contact inspection method that detects the infrared radiation a surface emits and converts it into a thermal image a certified thermographer can interpret. FPA uses it to find hot electrical connections, stressed mechanical components, process temperature problems and hidden moisture while equipment stays in service.
What is infrared thermography?
Temperature Patterns Tell a Story Your Eyes Cannot See
A thermal camera detects the infrared radiation emitted by a surface and converts it into an image a trained thermographer can read.
The image is only the beginning. Asset type, load, emissivity, reflected energy, ambient conditions and the comparison points you choose all change what a temperature pattern means. A warm motor on a hot afternoon may be fine; the same reading on one phase of three identical connections is not. FPA pairs field context with the thermal data to separate normal heat from a condition that deserves a work order.
What an infrared inspection finds
- Electrical hot spots and loose terminations
- Developing mechanical heat and friction
- Process temperature and insulation problems
- Hidden leaks and roof moisture patterns
One technology, four inspection types
4 Infrared Thermography Inspection Types
Thermography works when the route, the operating condition and the comparison method match the question you are trying to answer. These are the four scopes FPA builds routes around, and most facilities combine two or more.
01
Electrical systems
Compare phases, terminations, breakers, conductors and connections while the equipment operates under documented load. This is where infrared thermography finds the most failures per hour of inspection.
- Switchgear, panels and MCCs
- Transformers and disconnects
- Connections and terminations
02
Mechanical assets
Look for abnormal friction, loading, lubrication or cooling patterns across bearings, couplings, motors and driven equipment, and confirm what vibration data is already suggesting.
- Motors, pumps and gearboxes
- Bearings and couplings
- Conveyors and rotating assets
03
Process systems
Visualize temperature distribution across piping, steam systems, vessels and reactions without interrupting production or drilling a single test port.
- Steam traps and valves
- Insulation and refractory
- Process temperature uniformity
04
Buildings and structures
Investigate energy loss, moisture patterns, roof systems and envelope anomalies when environmental conditions support the inspection.
- Roof moisture surveys
- Insulation discontinuities
- HVAC distribution

From pixels to priorities
The 5-Step Infrared Thermography Inspection Process
A thermogram without context is just a colorful picture.
Step 01
Plan the route
Define the critical assets, access requirements, operating conditions and the questions the inspection has to answer.
Step 02
Capture context
Document asset identification, visible condition, ambient environment, load and the comparison points that make a reading meaningful.
Step 03
Acquire thermal data
Collect focused, properly ranged images from repeatable positions, following safe inspection practice for energized equipment.
Step 04
Interpret the pattern
Evaluate temperature differences against asset design, measured current, process state and the likely heat-transfer paths.
Step 05
Prioritize action
Deliver documented findings with a clear severity ranking, recommended verification and a practical next step.
The difference is in the context
Why FPA Measures Current, Not Just Temperature
On electrical equipment, temperature rise moves with load. A connection carrying 80 amps will run warmer than an identical one carrying 30, and that difference says nothing about its condition. FPA technicians record phase currents with an amp clamp during the survey, so a hot spot can be judged against what the component is actually carrying.
That one habit is the difference between a report full of warm things and a report that tells you which connection to torque during the next outage.
01Capture the thermal pattern02Compare current across phases03Evaluate like-for-like components04Connect the evidence to an action
Service areas
Related Visual Vibration Analysis landing pages
Louisiana
Nebraska
New Mexico
Oklahoma
Texas
4 Things Every FPA Thermography Report Contains
Condition monitoring and field service experience connected to the corrective action
A strong infrared thermography report preserves what was seen, under what conditions, why it matters and what should happen next. That record is also what makes the next survey comparable.
Paired imagery
Visible and infrared views of the same asset, so anyone can recognize what was inspected.
Operating context
Load, ambient conditions, emissivity assumptions and the comparison points used.
Finding priority
A clear severity ranking you can plan work against, not a list of warm items.
Recommended action
The verification or maintenance step that follows, and when it should happen.
Frequently asked questions
Infrared Thermography Questions, Answered
Every inspection depends on the asset, the load, the access and the environment. Send those details and FPA can scope the right route before the first image is captured.
Get in touch
What Is the Heat Trying to Tell You?
Tell us which assets matter, when they operate and what has changed. An FPA thermographer will help define an infrared thermography route that produces evidence your maintenance team can act on.
Main: (832) 930-0756